Unveiling the Power: Business Intelligence Tools for Stitch Analytics
In the dynamic landscape of data-driven decision-making, the ability to harness and interpret information effectively is paramount. For businesses leveraging the robust data integration capabilities of Stitch, the integration of Business Intelligence (BI) tools becomes a critical component. This article delves into the world of Business Intelligence tools for Stitch Analytics, exploring their synergistic relationship and the transformative potential they unlock. We will examine various tools, their functionalities, and how they empower businesses to gain actionable insights from their data.
Stitch, a cloud-based ETL (Extract, Transform, Load) service, simplifies the process of data integration. It allows businesses to connect to various data sources, extract data, transform it into a usable format, and load it into a data warehouse or data lake. However, the raw data, while valuable, requires analysis to extract meaningful insights. This is where Business Intelligence tools come into play. These tools provide the means to visualize, analyze, and interpret the data extracted and transformed by Stitch.
The Synergy Between Stitch and Business Intelligence
The combination of Stitch and Business Intelligence tools offers a powerful data analytics solution. Stitch acts as the foundation, providing a reliable and efficient data pipeline. Business Intelligence tools build upon this foundation, allowing users to explore, analyze, and visualize the data. This synergy enables businesses to:
- Gain a Holistic View of Data: By integrating data from multiple sources, Stitch provides a comprehensive data set. Business Intelligence tools then allow users to analyze this data from a unified perspective.
- Make Data-Driven Decisions: The insights derived from Business Intelligence tools empower businesses to make informed decisions based on concrete evidence, improving strategic planning and operational efficiency.
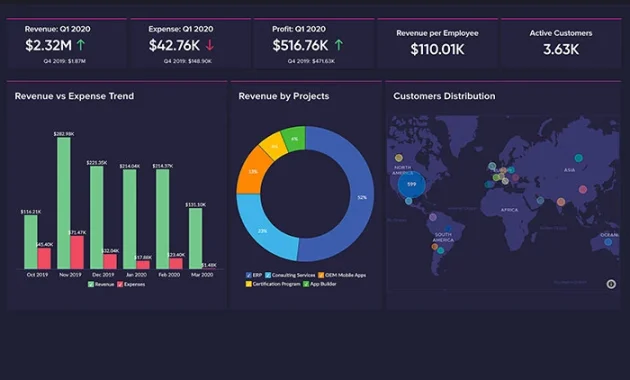
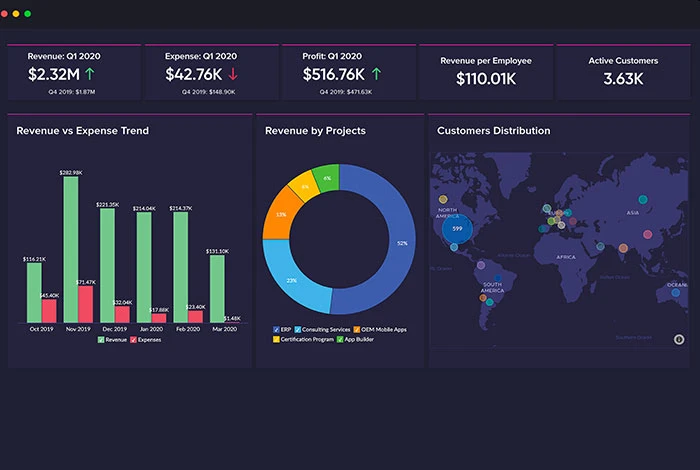
- Improve Reporting and Dashboards: Business Intelligence tools facilitate the creation of customizable dashboards and reports that track key performance indicators (KPIs), providing real-time insights into business performance.
- Enhance Collaboration: Many Business Intelligence tools offer features for sharing insights and collaborating on data analysis, promoting data literacy across the organization.
Key Features of Effective Business Intelligence Tools
When selecting Business Intelligence tools for use with Stitch, certain features are crucial. These features ensure that the tools can effectively leverage the data provided by Stitch and provide valuable insights.
- Data Connectivity: The ability to connect to various data sources, including those supported by Stitch (e.g., databases, cloud applications, marketing platforms) is essential.
- Data Transformation Capabilities: The ability to prepare and transform data for analysis, including cleaning, aggregation, and data type conversions.
- Data Visualization: Powerful visualization tools, such as charts, graphs, and maps, to present data in an easily understandable format.
- Interactive Dashboards: The ability to create interactive dashboards that allow users to explore data, filter results, and drill down into details.
- Reporting and Analysis: Features for generating reports, performing statistical analysis, and identifying trends and patterns.
- Scalability and Performance: The ability to handle large datasets and complex queries without compromising performance.
- User-Friendly Interface: An intuitive and easy-to-use interface that allows users of all skill levels to access and analyze data.
Top Business Intelligence Tools for Stitch Analytics
Several Business Intelligence tools seamlessly integrate with Stitch, offering a range of features and capabilities to meet diverse business needs. Here are a few of the leading options:
Tableau
Tableau is a widely recognized Business Intelligence tool known for its intuitive interface and powerful data visualization capabilities. It allows users to connect to a wide array of data sources, including those supported by Stitch, and create interactive dashboards and reports. Tableau excels in:
- Ease of Use: Tableau’s drag-and-drop interface makes it easy for users to create visualizations and dashboards.
- Data Visualization: Tableau offers a wide range of visualization options, allowing users to present data in a clear and compelling manner.
- Interactive Dashboards: Tableau dashboards are highly interactive, allowing users to explore data and drill down into details.
- Data Integration: Tableau has excellent connectivity with various data sources, including those that Stitch supports.
Looker
Looker, now owned by Google, is a Business Intelligence tool that focuses on data modeling and collaborative analysis. It allows users to define a single source of truth for their data, ensuring consistency and accuracy across the organization. Looker’s strengths include:
- Data Modeling: Looker’s data modeling language (LookML) allows users to define data relationships and create reusable metrics.
- Collaboration: Looker’s collaborative features enable teams to work together on data analysis and share insights.
- Data Governance: Looker provides robust data governance features, ensuring data quality and consistency.
- Integration: Excellent integration capabilities with various data sources, including those that Stitch supports.
Power BI
Microsoft Power BI is a powerful and cost-effective Business Intelligence tool that offers a wide range of features for data analysis and visualization. It integrates seamlessly with other Microsoft products and is a popular choice for businesses of all sizes. Power BI’s key features are:
- Affordability: Power BI offers a free version and affordable paid plans, making it accessible to businesses of all sizes.
- Data Visualization: Power BI offers a wide range of visualization options and interactive dashboards.
- Integration: Excellent integration with other Microsoft products, such as Excel and Azure.
- Data Connectivity: Supports a wide range of data sources, compatible with Stitch integration.
Other Notable Tools
Beyond these three industry leaders, other Business Intelligence tools can effectively complement Stitch. These options include:
- Qlik Sense: Known for its associative data modeling capabilities.
- Sisense: Offers a focus on embedded analytics and ease of use.
- ThoughtSpot: Provides natural language search capabilities for data exploration.
Choosing the Right Business Intelligence Tool
Selecting the right Business Intelligence tool is a crucial decision. The best choice depends on a number of factors, including:
- Business Needs: Consider the specific requirements of your business, such as the types of data you need to analyze, the complexity of your analysis, and the reporting needs.
- Technical Expertise: Evaluate the technical skills of your team and choose a tool that aligns with their capabilities. Some tools are easier to learn and use than others.
- Budget: Consider the cost of the tool, including licensing fees, implementation costs, and ongoing maintenance expenses.
- Data Volume and Complexity: The volume and complexity of your data will influence the tool’s scalability and performance requirements.
- Integration with Stitch: Ensure the tool seamlessly integrates with Stitch and supports the data sources you are using.
By carefully considering these factors, businesses can choose a Business Intelligence tool that aligns with their needs and unlocks the full potential of their data.
Implementing Business Intelligence Tools with Stitch
The implementation process is straightforward. The general steps are:
- Connect Stitch to Data Sources: Configure Stitch to extract data from your various sources.
- Transform Data: Use Stitch to transform the data into a usable format and load it into your data warehouse or data lake.
- Connect the BI Tool to Your Data Warehouse: Connect your chosen Business Intelligence tool to your data warehouse or data lake.
- Model Your Data: Define the data models and relationships within your BI tool.
- Create Dashboards and Reports: Build interactive dashboards and reports to visualize your data and gain insights.
- Analyze and Share Insights: Analyze the data, identify trends, and share your findings with your team.
The Future of Business Intelligence and Stitch
The synergy between Stitch and Business Intelligence tools is poised to become even more powerful in the future. As data volumes continue to grow and businesses strive for greater agility, the demand for sophisticated data analytics solutions will increase. We can expect to see:
- Enhanced Integration: Deeper integrations between Stitch and Business Intelligence tools, enabling seamless data flow and analysis.
- Advanced Analytics: The integration of advanced analytics capabilities, such as machine learning and artificial intelligence, to uncover deeper insights.
- Automated Insights: The development of automated insights and recommendations, allowing businesses to make decisions more quickly and efficiently.
- Increased Data Democratization: Easier access to data and insights for users of all skill levels, promoting data literacy across organizations.
By embracing the power of Business Intelligence tools in conjunction with Stitch, businesses can transform raw data into actionable insights, driving better decision-making and achieving their strategic goals. The future is bright for data-driven organizations that leverage the power of this dynamic duo.
[See also: Data Warehousing for Beginners]
[See also: Choosing the Right ETL Tool]
[See also: Data Visualization Best Practices]

