Business Intelligence Tools to Track Immersion: A Deep Dive into Engagement
In the ever-evolving digital landscape, understanding user engagement is paramount. Businesses are constantly seeking ways to not only attract audiences but also to keep them captivated. This is where the power of Business Intelligence (BI) tools comes into play, offering invaluable insights into user immersion. This article explores the critical role of Business Intelligence tools in tracking immersion, examining the metrics that matter, and providing a roadmap for businesses aiming to enhance user engagement.
Understanding Immersion in the Digital Age
Immersion, in the context of digital platforms, refers to the degree to which a user is engrossed in an experience. It’s about capturing attention and sustaining interest. This goes beyond mere clicks and views. It is about creating a compelling experience that keeps users engaged and coming back for more. Measuring immersion requires a nuanced approach. It goes beyond simple metrics like time spent on a page. It involves analyzing a range of behaviors and interactions. This can include scrolling depth, feature usage, and social sharing.
The Role of Business Intelligence Tools
Business Intelligence tools provide the analytical infrastructure needed to measure and understand immersion. They collect, process, and visualize data from various sources. This allows businesses to gain a comprehensive view of user behavior. These tools offer dashboards and reporting features that highlight key performance indicators (KPIs). They also provide interactive visualizations that make complex data easier to understand. This is crucial for identifying trends and patterns related to immersion.
Key Metrics for Tracking Immersion
Several key metrics can be tracked using Business Intelligence tools. These metrics provide valuable insights into user engagement and immersion levels.
- Time on Page: This is a fundamental metric, but it is still important. It indicates how long users spend on a specific page. It can be a good indicator of content engagement.
- Scroll Depth: Measuring how far users scroll down a page reveals their interest in the content. It helps assess the effectiveness of content placement and design.
- Click-Through Rates (CTR): Clicks on specific elements, such as calls-to-action (CTAs), indicate user interaction. High CTRs suggest users are engaged and interested in taking action.
- Feature Usage: For applications and interactive platforms, tracking feature usage is crucial. It shows which features users are actively using. It also reveals which ones they are ignoring.
- Conversion Rates: This metric measures the percentage of users who complete a desired action. It could be a purchase, a sign-up, or a download. High conversion rates indicate strong engagement and immersion.
- Session Length: The total time a user spends on a website or application in a single session is a good indicator. Longer sessions suggest higher levels of immersion.
- Bounce Rate: A high bounce rate suggests users are leaving a page quickly. This could indicate a lack of engagement or poor content relevance.
- Return Rate: Tracking the percentage of returning visitors shows how effectively a platform retains users. It indicates the long-term appeal and immersion of the experience.
Choosing the Right Business Intelligence Tools
Selecting the right Business Intelligence tools is essential for effectively tracking immersion. Several factors should be considered during the selection process.
- Data Integration: The tool should seamlessly integrate with various data sources. This includes web analytics platforms, CRM systems, and social media channels.
- Data Visualization: Powerful data visualization capabilities are crucial. These help in creating clear and informative dashboards and reports.
- Ease of Use: The tool should be user-friendly, with an intuitive interface. This allows users to quickly understand data and generate insights.
- Scalability: The tool must be able to handle growing data volumes as the business expands. It must maintain performance and accuracy.
- Reporting and Analytics: Robust reporting and analytics features are important. These enable in-depth analysis and trend identification.
- Customization: The ability to customize dashboards and reports to meet specific business needs is also vital.
- Cost: Consider the pricing model and ensure it aligns with the budget. Evaluate the total cost of ownership.
Popular Business Intelligence Tools for Immersion Tracking
Several Business Intelligence tools excel in tracking immersion. These tools provide comprehensive features for data analysis and visualization. They help businesses gain a deeper understanding of user engagement.
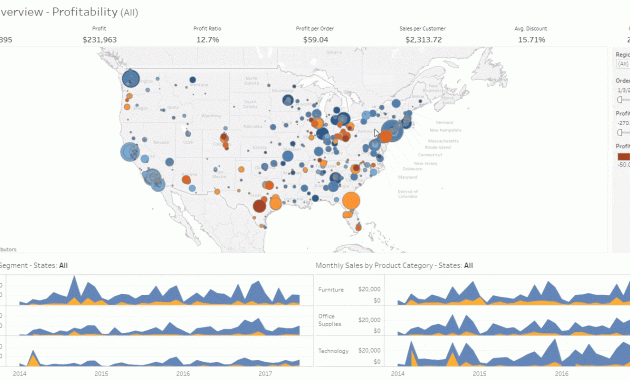
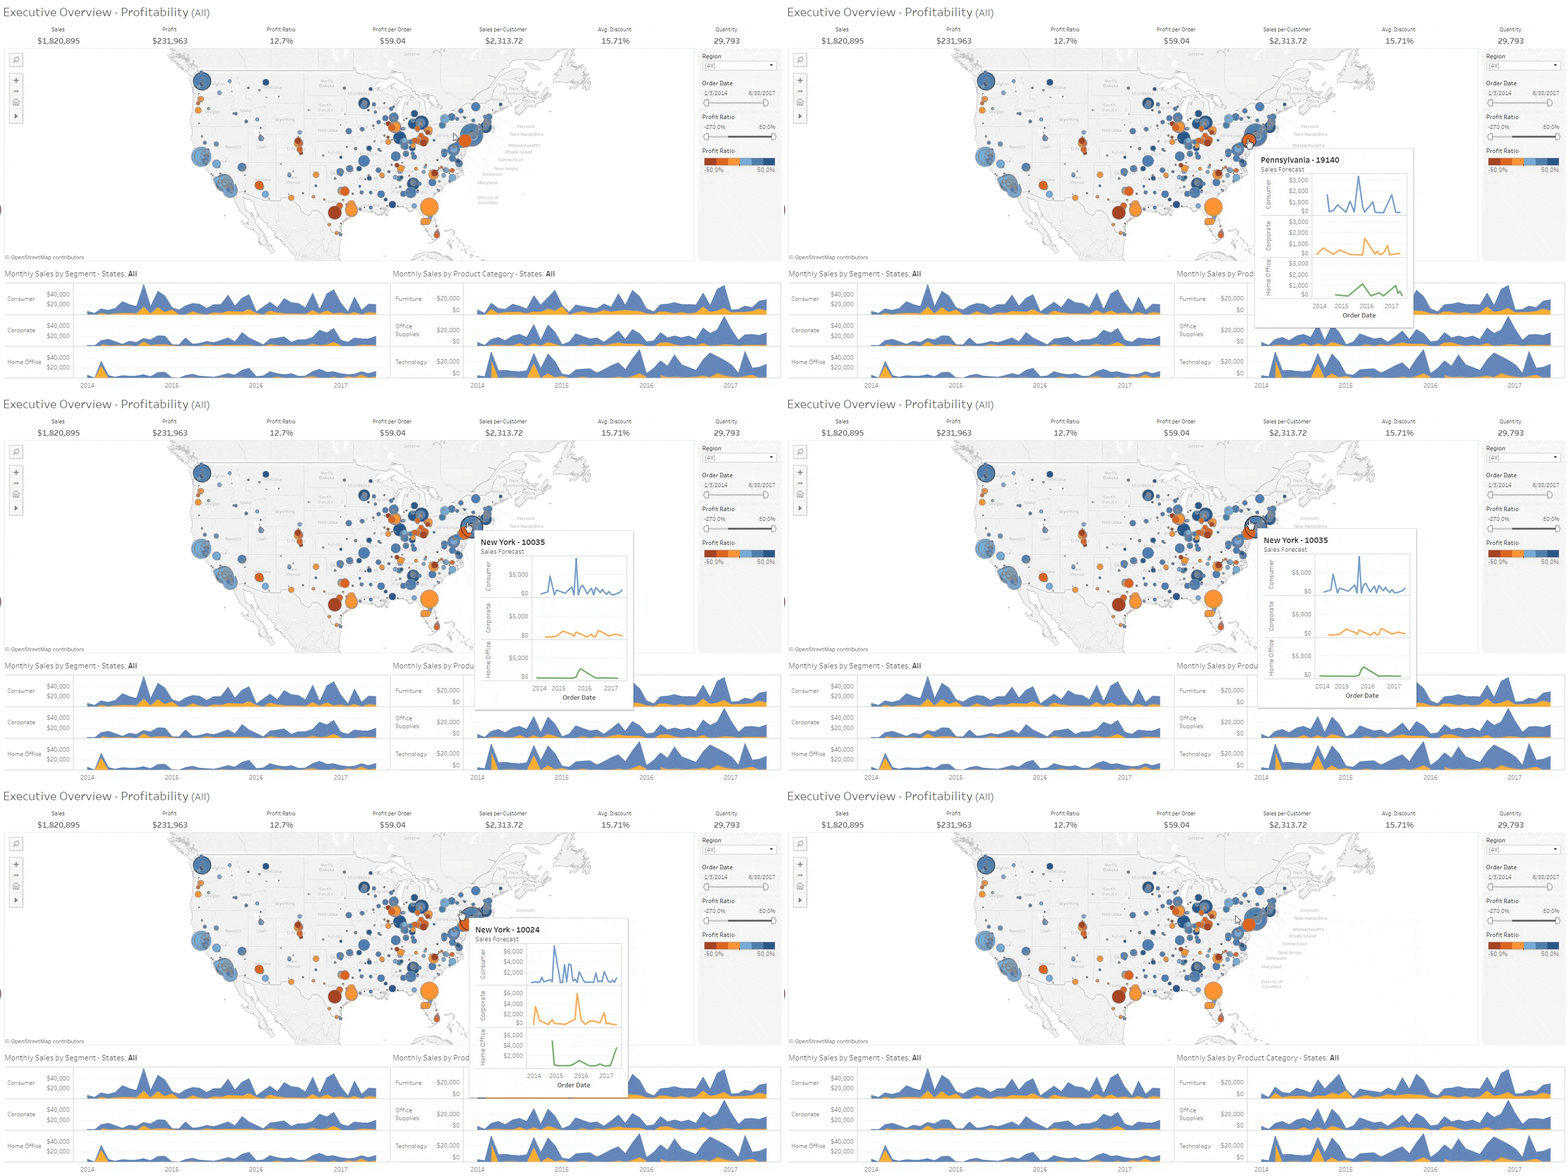
- Tableau: Tableau is a leading BI tool known for its powerful data visualization capabilities. It offers a wide range of features for creating interactive dashboards. It is ideal for tracking immersion metrics.
- Microsoft Power BI: Power BI is another popular choice, offering a user-friendly interface and seamless integration with Microsoft products. It provides extensive reporting and analytical features.
- Google Data Studio: Data Studio is a free tool that integrates with various Google services. It is a great option for businesses looking for a cost-effective solution.
- Looker: Looker is a data analytics platform that focuses on data modeling and exploration. It allows for in-depth analysis of user behavior.
- Qlik Sense: Qlik Sense is a self-service BI tool with a focus on data discovery and exploration. It helps users uncover hidden insights related to immersion.
Implementing a Strategy for Tracking Immersion
Implementing a successful strategy for tracking immersion involves several key steps. These steps ensure the effective use of Business Intelligence tools.
- Define Objectives: Clearly define the goals of tracking immersion. Determine what insights are needed.
- Choose Tools: Select the appropriate Business Intelligence tools based on business needs and requirements.
- Collect Data: Implement tracking mechanisms to collect relevant data from various sources.
- Analyze Data: Use the chosen tools to analyze the collected data. Identify trends and patterns.
- Create Dashboards: Design and create dashboards to visualize key metrics and KPIs. This allows for easy monitoring.
- Generate Reports: Generate regular reports to share insights with stakeholders. This facilitates informed decision-making.
- Optimize: Continuously optimize the user experience based on the insights gained. This helps increase engagement.
Real-World Examples of Immersion Tracking
Several businesses have successfully used Business Intelligence tools to track immersion. They have improved user engagement and achieved business goals. These examples demonstrate the practical applications of these tools.
- E-commerce: E-commerce businesses use BI tools to track product page views, add-to-cart rates, and purchase completion rates. This identifies areas for improvement in the customer journey.
- Media Websites: Media websites track time on page, scroll depth, and video views to assess content engagement. They optimize content and design based on these metrics.
- SaaS Companies: SaaS companies monitor feature usage, session length, and conversion rates. They tailor their products to meet user needs.
- Mobile Apps: Mobile app developers track in-app purchases, user retention rates, and feature engagement. They improve the app experience.
Challenges and Considerations
While Business Intelligence tools offer significant benefits, there are also challenges. These challenges must be addressed to ensure effective tracking of immersion. These are important considerations.
- Data Accuracy: Ensuring the accuracy of data is critical. Implement data validation processes.
- Data Privacy: Comply with data privacy regulations like GDPR and CCPA. Respect user privacy.
- Data Interpretation: Avoid misinterpreting data. Use multiple metrics for a comprehensive view.
- Technical Skills: Some BI tools require technical expertise. Invest in training or hire skilled personnel.
- Integration Complexity: Integrating data from multiple sources can be complex. Plan the integration carefully.
The Future of Immersion Tracking
The future of immersion tracking looks promising. Advancements in AI and machine learning are set to revolutionize the way businesses understand user engagement. These technologies will provide more personalized and predictive insights. This will allow for even more effective strategies to enhance user immersion.
AI-powered analytics will provide deeper insights into user behavior. It will also improve the accuracy of predictions. This enables businesses to anticipate user needs. Personalized experiences will become more common, leading to higher engagement. Businesses will be able to tailor content and interactions to individual user preferences. This will increase immersion levels.
Conclusion
Business Intelligence tools are essential for tracking immersion. They provide the data and insights needed to understand user engagement. By using these tools effectively, businesses can create more compelling experiences. They can also drive better outcomes. The key is to choose the right tools, implement a clear strategy, and continuously optimize based on data-driven insights. As technology advances, the ability to understand and enhance immersion will only become more sophisticated and critical for business success. [See also: Related Article Titles]

